The dbms_profiler package is a built-in set of procedures to capture performance information from PL/SQL.
1. dbms_profiler.start_profiler
2. dbms_profiler.flush_data
3. dbms_profiler.stop_profiler
The basic idea behind profiling with dbms_profiler is for the developer to understand where their code is spending the most time, so they can detect and optimize it.
Once you have run the profiler, Oracle will place the results inside the dbms_profiler tables.
The dbms_profiler procedures are not a part of the base installation of Oracle.
$ORACLE_HOME/rdbms/admin directory
proftab.sql - Creates three tables and a sequence and must be executed before the profload.sql file.
profload.sql - Creates the package header and package body for DBMS_PROFILER. This script must be executed as the SYS user.
1. Starting a Profiling Session
dbms_profiler.start_profiler ('Performance Test of a pl/sql block');
2. Flushing Data during a Profiling Session
The flush command enables the developer to dump statistics during program execution without stopping the profiling utility. The only other time Oracle saves data to the underlying tables is when the profiling session is stopped
dbms_profiler.flush_data();
3. Stopping a Profiling Session
Once the developer stops the profiler, all the remaining (unflushed) data is loaded into the profiler tables.
dbms_profiler.stop_profiler();
Profiler Data saves to the below set of tables.
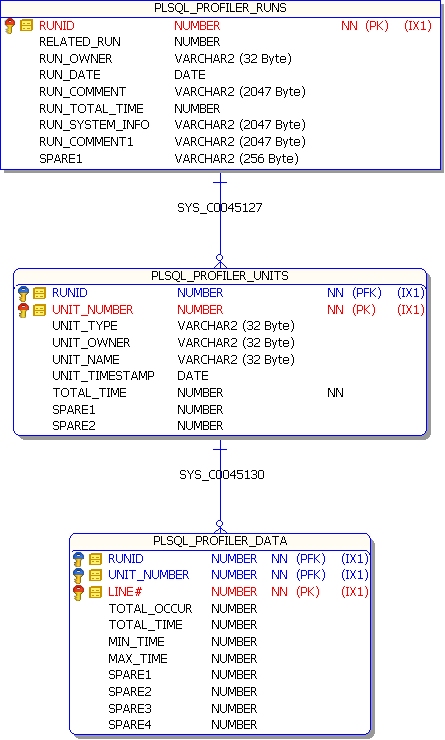
1. plsql_profiler_runs
2. plsql_profiler_units
3. plsql_profiler_data
-- Total time spent on each run
select runid,
substr(run_comment,1, 30) as run_comment,
run_total_time/100000000000 as secs
from (select a.runid, sum(a.total_time) run_total_time, b.run_comment
from plsql_profiler_units a, plsql_profiler_runs b
where a.runid = b.runid group by a.runid, b.run_comment )
where run_total_time > 0
order by runid asc;
-- Percentage of time in each module, for each run separately
select p1.runid,
substr(p2.run_comment, 1, 20) as run_comment,
p1.unit_owner,
decode(p1.unit_name, '', '',
substr(p1.unit_name,1, 20)) as unit_name,
p1.total_time/100000000000 as secs,
TO_CHAR(100*p1.total_time/p2.run_total_time, '999.9') as percentage
from plsql_profiler_units p1,
(select a.runid, sum(a.total_time) run_total_time, b.run_comment
from plsql_profiler_units a, plsql_profiler_runs b
where a.runid = b.runid group by a.runid, b.run_comment ) p2
where p1.runid=p2.runid
and p1.total_time > 0
and p2.run_total_time > 0
and (p1.total_time/p2.run_total_time) >= .01
order by p1.runid asc, p1.total_time desc;
-- Percentage of time in each module, summarized across runs
select p1.unit_owner,
decode(p1.unit_name, '', '', substr(p1.unit_name,1, 25)) as unit_name,
p1.total_time/100000000000 as secs,
TO_CHAR(100*p1.total_time/p2.grand_total, '99999.99') as percentage
from plsql_profiler_units_cross_run p1,
plsql_profiler_grand_total p2
order by p1.total_time DESC;
-- Lines taking more than 1% of the total time, each run separate
select p1.runid as runid,
p1.total_time/1000000000 as Hsecs,
p1.total_time/p4.grand_total*100 as pct,
substr(p2.unit_owner, 1, 20) as owner,
decode(p2.unit_name, '', '', substr(p2.unit_name,1, 20)) as unit_name,
p1.line#,
( select p3.text
from all_source p3
where p3.owner = p2.unit_owner and
p3.line = p1.line# and
p3.name=p2.unit_name and
p3.type not in ( 'PACKAGE', 'TYPE' )) text
from plsql_profiler_data p1,
plsql_profiler_units p2,
plsql_profiler_grand_total p4
where (p1.total_time >= p4.grand_total/100)
AND p1.runID = p2.runid
and p2.unit_number=p1.unit_number
order by p1.total_time desc;
-- Number of lines actually executed in different units (by unit_name)
select p1.unit_owner,
p1.unit_name,
count( decode( p1.total_occur, 0, null, 0)) as lines_executed ,
count(p1.line#) as lines_present,
count( decode( p1.total_occur, 0, null, 0))/count(p1.line#) *100
as pct
from plsql_profiler_lines_cross_run p1
where (p1.unit_type in ( 'PACKAGE BODY', 'TYPE BODY',
'PROCEDURE', 'FUNCTION' ) )
group by p1.unit_owner, p1.unit_name;
-- Number of lines actually executed for all units
select count(p1.line#) as lines_executed
from plsql_profiler_lines_cross_run p1
where (p1.unit_type in ( 'PACKAGE BODY', 'TYPE BODY',
'PROCEDURE', 'FUNCTION' ) )
AND p1.total_occur > 0;
-- Total number of lines in all units
SELECT COUNT(p1.line#) AS LINES_PRESENT
FROM plsql_profiler_lines_cross_run p1
WHERE (p1.unit_type in ( 'PACKAGE BODY', 'TYPE BODY',
'PROCEDURE', 'FUNCTION' ) );
Note :
The main resource consumers are those lines that execute SQL.
Once the data is sorted by average execution time, the statements that are the worst usually contain SQL.
Optimize and tune the SQL
Example:
Create or replace function profiler_test_function return number is
begin
dbms_lock.sleep(10);
return 100;
end profiler_test_function;
/
show errors;
Create or replace procedure Profiler_test_procedure is
loopcounter number:=10;
begin
dbms_output.put_line('Start');
loop
dbms_lock.sleep(1);
dbms_output.put_line(loopcounter);
loopcounter:=loopcounter-1;
exit when loopcounter=0;
end loop;
loopcounter :=10;
loop
dbms_output.put_line(profiler_test_function);
loopcounter:=loopcounter-1;
exit when loopcounter=0;
end loop;
dbms_output.put_line('End');
end Profiler_test_procedure;
/
show errors;
begin
dbms_profiler.start_profiler ('Test Run1');
Profiler_test_procedure;
dbms_profiler.stop_profiler ;
end;
/
Results:

begin
dbms_profiler.start_profiler ('Test Run2');
Profiler_test_procedure;
dbms_profiler.stop_profiler ;
end;
/
No comments:
Post a Comment